True visibility into independent convenience retail with SKU-level data from over 15,000 retailers. Skupos Insights gives you data from a market you've never had visibility into before!
Explore below to learn how Skupos Insights can help you build a data-driven convenience retail strategy.
What Does Independent Convenience Retail Look Like Right Now?
Powered by the Skupos network of over 15,000 retailers, this data snapshot provides the most comprehensive view of independent retail. This data is updated on a monthly basis, providing a timely look at performance trends.
Index vs. 1 Year Ago
Hover over lines to see exact data points, click the legend to highlight certain lines.
Drive Change with Skupos Insights
Skupos Insights provides key visibility into independent convenience retail stores nationwide. Identify drivers of market share changes, pinpoint distribution and assortment opportunities, and maximize ROI through pricing and promotion. With over 10 dashboards to choose from, the opportunities are endless - starting exploring Skupos Insights dashboards now!
×
Get Started with Skupos Insights
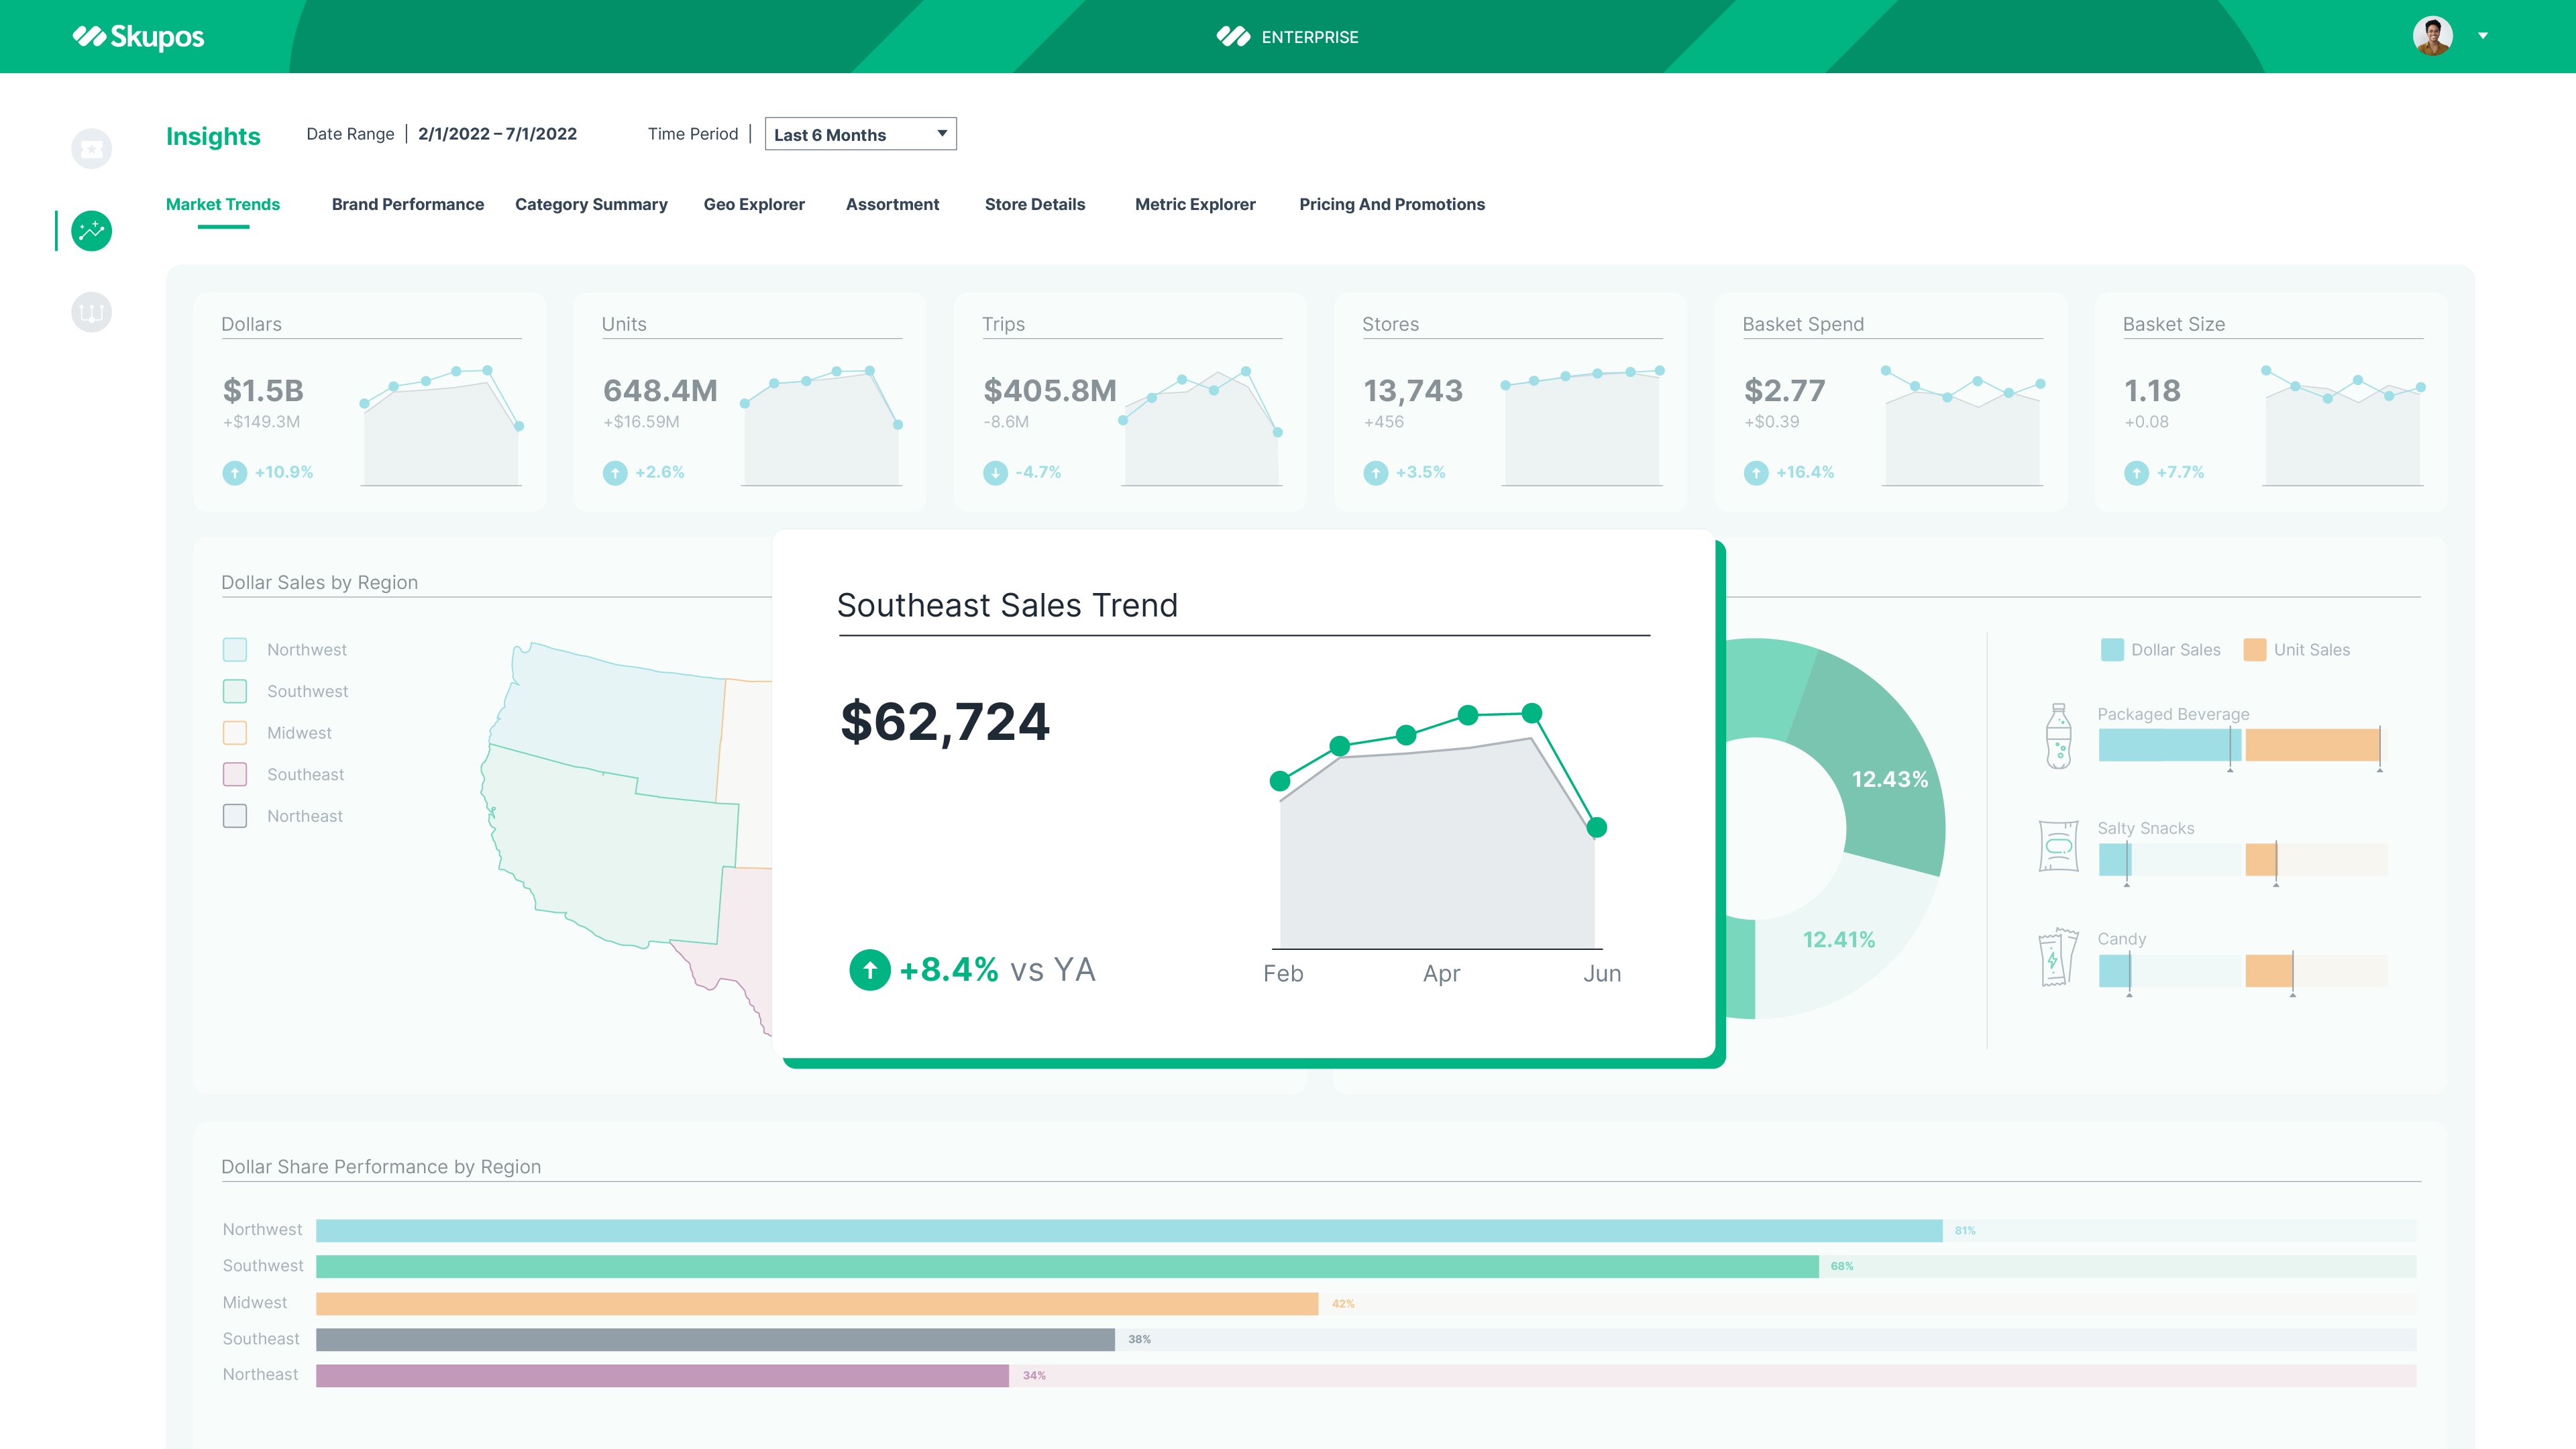
Market Trends
Understand how stores, regions, and categories in the Skupos network are performing over time. Tap into a specific category to view dollar sales, unit sales, performance by region, and so much more.
Geo Explorer
Hone in on a brand’s performance through sales metrics and understand how regions and states are impacting share. Take it one step further and identify specific drivers of market share changes - sales, dollars, pricing, or distribution.
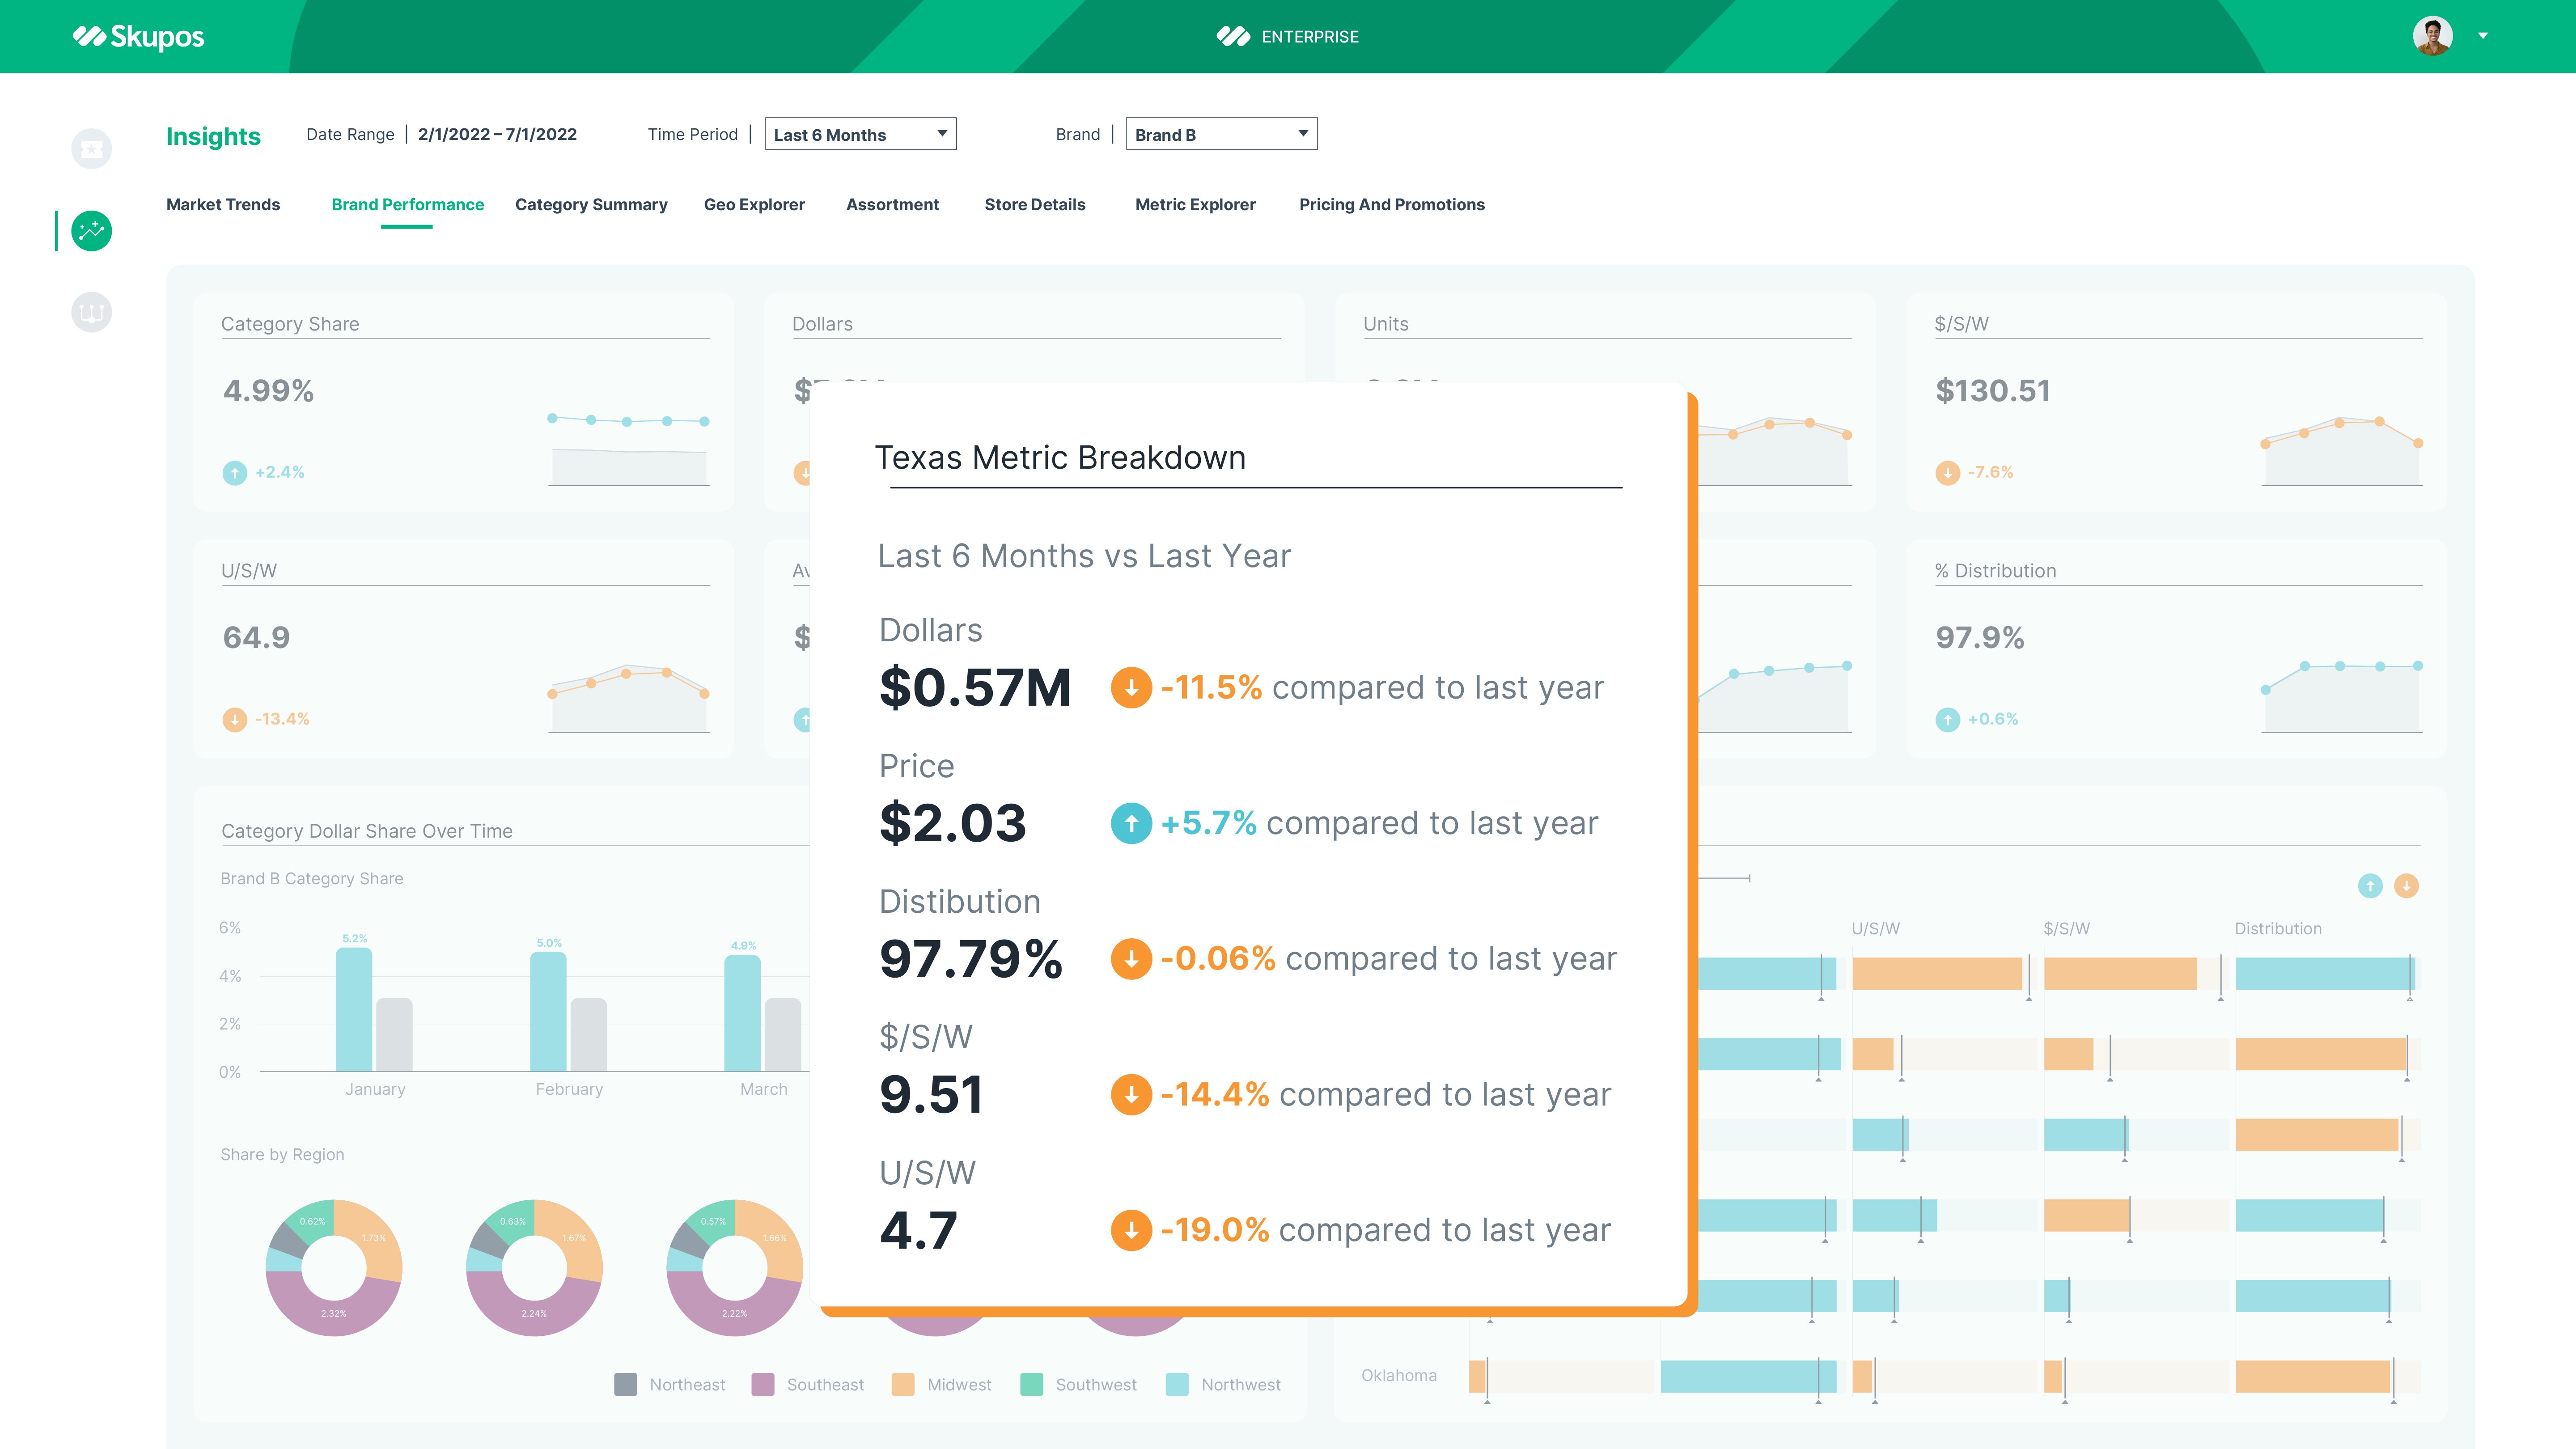
Brand Performance
Hone in on a brand’s performance through sales metrics and understand how regions and states are impacting share. Take it one step further and identify specific drivers of market share changes - sales, dollars, pricing, or distribution.
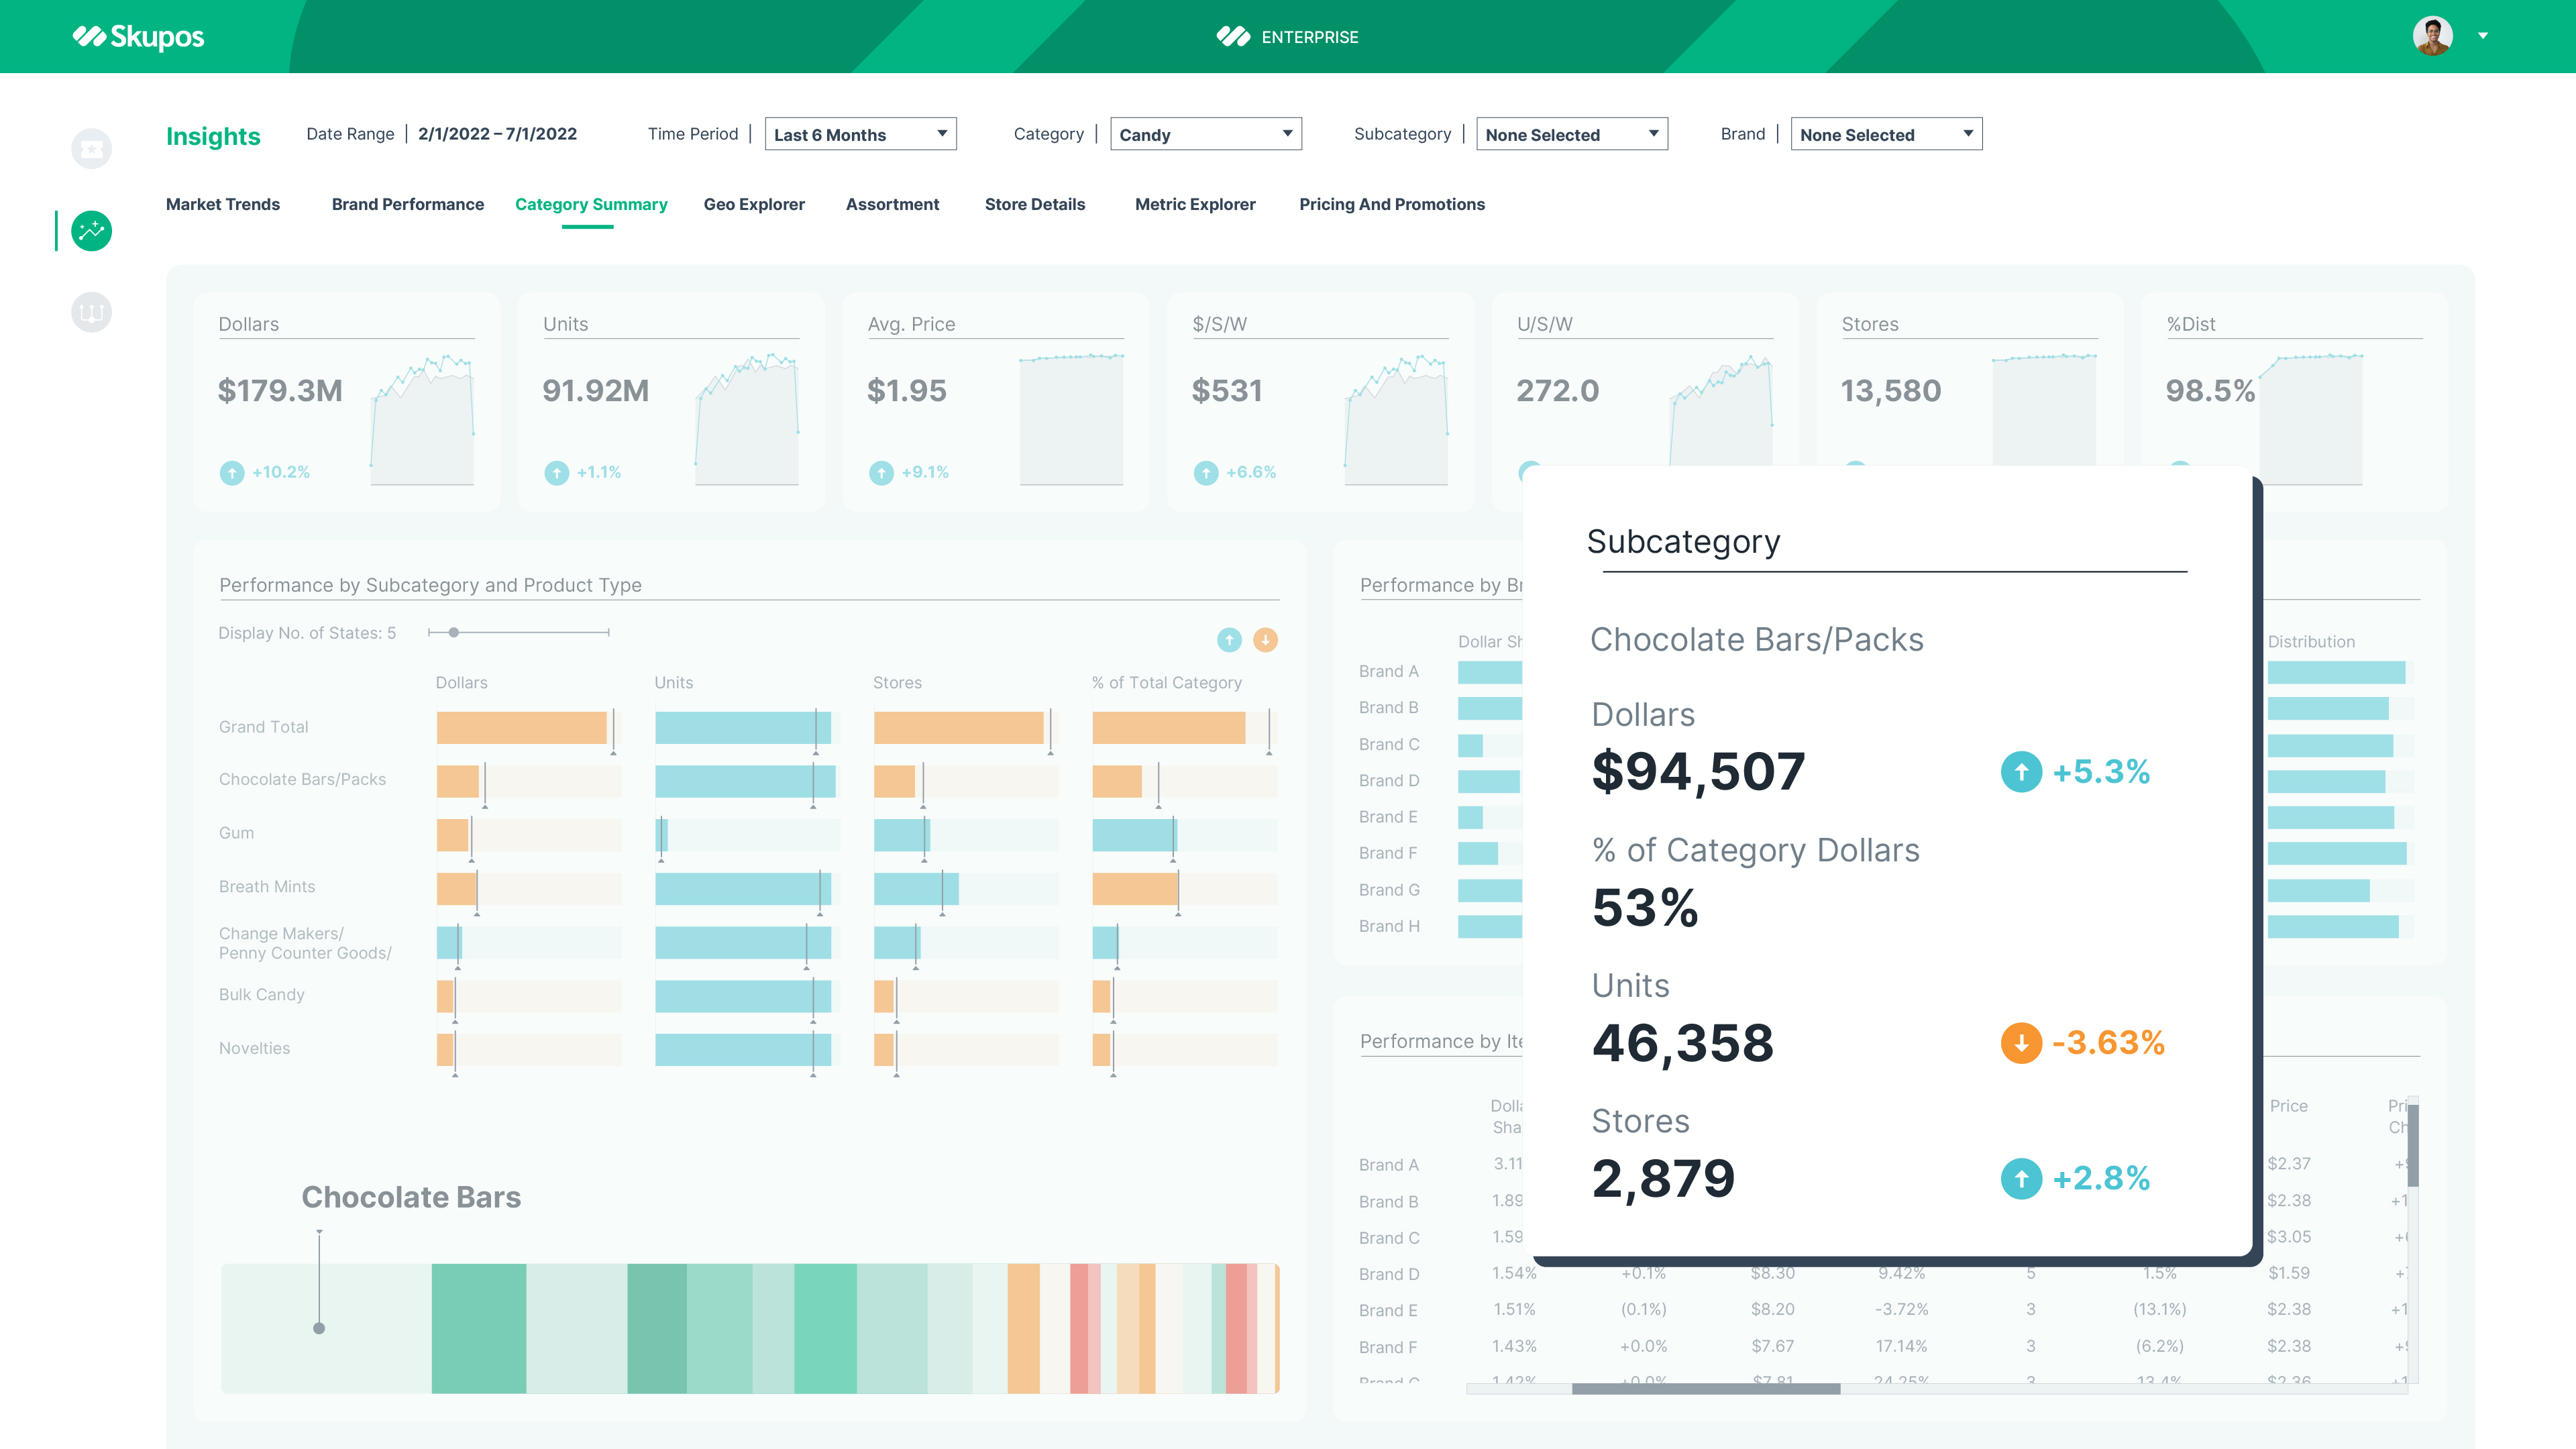
Category Summary
Tap into sales and distribution performance metrics at a category, subcategory, brand, and product level. Leverage these insights to understand what is affecting share within a category and how individual items stack up against competitors.
How to Action Dashboards: Deep Dive with our Product Manager
Skupos Insights now includes 11+ dashboards that help brands solve a variety of use cases ranging from distribution, price elasticity, geographic trends, and optimized pricing. We sat down with our product manager, Carolyn Chupa, to give youan insider's look at our new dashboards!